
How to Look Up Nueces County Jail Population Data
Two official sources hold the bulk of Nueces County jail population data. The Texas Commission on Jail Standards publishes monthly and annual jail population reports for every county in the state. The Sheriff's Office also posts annual reports, with the 2024-2025, 2022-2023, and 2021-2022 reports linked from the county site. Both sources update on their own schedule, and the numbers can shift between report dates as bookings, releases, and transfers move people through the facility.
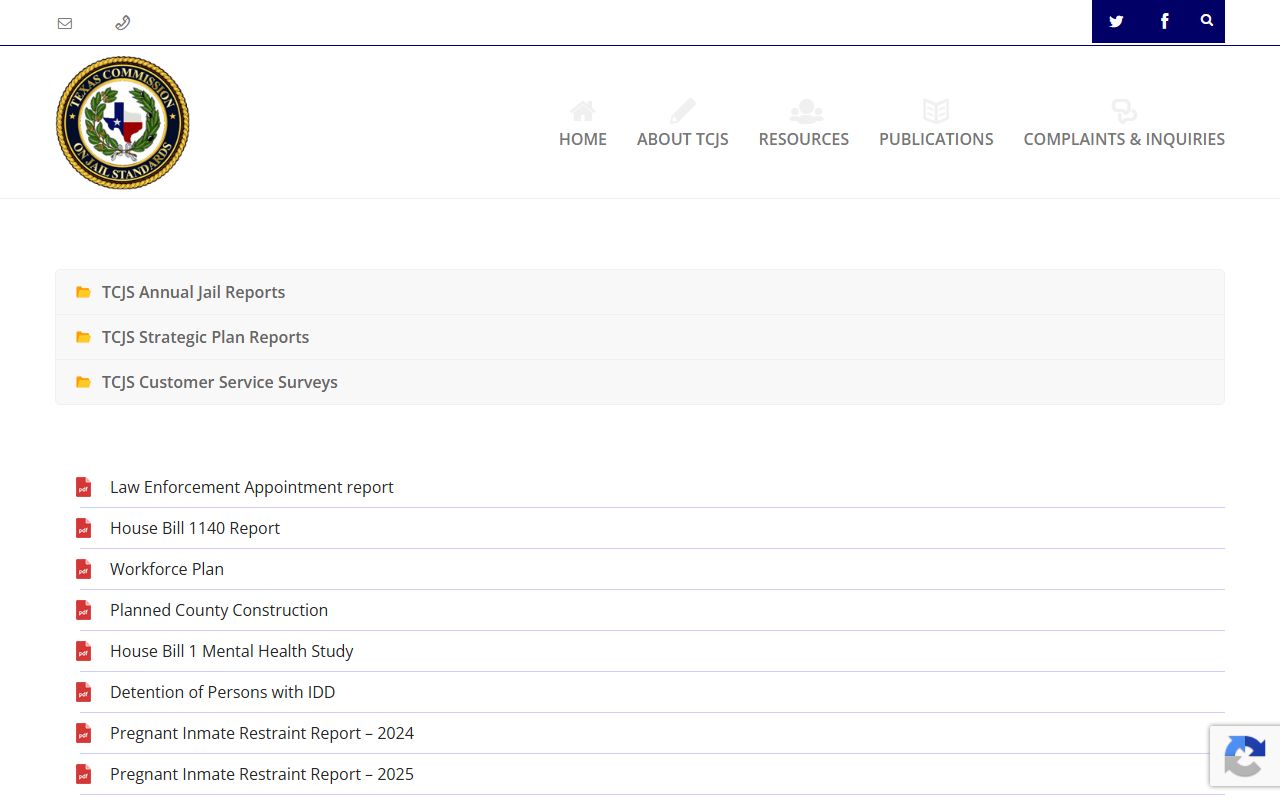
The screenshot is from the Texas Commission on Jail Standards reports page, which posts the official statewide jail data the Sheriff's Office and policy groups use.
For a specific name lookup, this page is the wrong tool, since the Sheriff's Office does not post a public roster. The Nueces County inmate records page covers that path.
Nueces County Jail Capacity Overview
Capacity is the rated number of beds the state has approved for a facility. The Texas Commission on Jail Standards sets the rated capacity and tracks current population against it. The Sheriff's Office runs a Main Jail at 901 Leopard Street and a McKenzie Annex at 745 North Padre Island Drive, with the commissary kiosk also located at the Annex.
| Facility | Location | Source for Current Capacity |
|---|---|---|
| Nueces County Jail | 901 Leopard St., Corpus Christi | TCJS jail population reports |
| McKenzie Annex | 745 North Padre Island Drive | TCJS jail population reports |
| Total county rated capacity | Combined facilities | TCJS monthly or annual jail report |
Current rated capacity is best pulled from the most recent TCJS report rather than from older summaries. Numbers shift when units come online or offline for maintenance, staffing, or classification reasons.
Average Daily Population
Average daily population, or ADP, is the count averaged across each day in a reporting period. ADP smooths out single-day swings from a big booking day or a weekend release. TCJS reports include ADP alongside the one-day count, and the sheriff annual reports usually show ADP and admissions for the year.
Read both together. A county with the same rated capacity can run very different ADPs depending on policing, court speed, bond practices, and the share of pretrial defendants. For Nueces County, look at the current TCJS monthly report and the most recent sheriff annual report side by side.
Nueces County Demographic Context
Jail population sits inside a larger county. Census QuickFacts gives the county denominators that help frame any jail figure. The county had a 2025 estimated population of 352,992 and a 2020 Census population of 353,178, with a land area of 839.07 square miles. These are county figures, not jail figures, and they are the baseline researchers use when they calculate rates per 100,000 residents.
| Field | Nueces County |
|---|---|
| 2025 estimated population | 352,992 |
| 2020 Census population | 353,178 |
| Hispanic or Latino | 63.4% |
| Persons under 18 | 23.2% |
| Persons 65 and over | 16.8% |
| Female persons | 50.3% |
| Median household income, 2020-2024 | $66,897 |
| Poverty rate | 15.3% |
Census figures come from the Census Bureau QuickFacts page for Nueces County, Texas. The jail's own demographic mix is reported separately by the Sheriff's Office and TCJS and is not the same as the county-wide breakdown.
Pretrial vs Sentenced Population
County jails hold two main groups: pretrial defendants who have not been convicted and people serving short sentences or waiting on transfer. In Texas counties, pretrial defendants are usually the larger share of the daily count. That share moves with bond schedules, case-processing time, and the use of personal bonds. TCJS reports separate the pretrial and sentenced counts so readers can see the split for Nueces County.
| Group | Description | Source |
|---|---|---|
| Pretrial | Awaiting case resolution, often with bond not yet posted | TCJS jail report |
| Sentenced | Serving a county sentence or waiting on TDCJ transfer | TCJS jail report |
| Federal / contract holds | Held under a federal or contract arrangement where applicable | TCJS and sheriff reports |
Misdemeanor vs Felony Population
Charge type also shapes the population. Felonies tend to run longer in pretrial because of more complex processing, more discovery, and higher bonds. Misdemeanors tend to clear faster. The mix between misdemeanor and felony cases in the Nueces County Jail is reported in the sheriff annual report and in the case data the District Clerk and county courts at law generate.
For background on what each level covers, the Nueces County District Court page and the arrest records page break out the differences.
Mental Health and Medical Population
A meaningful share of any county jail population needs mental-health or medical care. Nueces County set up a Mental Health Public Defender's Office in 2022, funded by a Texas Indigent Defense Commission grant, partly to address the legal side of that need. The office uses attorneys, social workers, and an investigator to handle cases for indigent defendants whose mental health is part of the picture.
For state oversight of jail standards, including medical and mental-health requirements, TCJS sets the rules and inspects facilities. The Sheriff's Office reports the relevant counts in its annual report.
State and National Context
To compare counties, researchers use a rate per 100,000 residents. The Bureau of Justice Statistics publishes national jail figures, and the Vera Institute of Justice tracks county-level incarceration trends across the United States. Reading Nueces County numbers alongside Texas and national rates puts the local figure in context.
| Comparison | Source | Use |
|---|---|---|
| Nueces County rate | TCJS + Census denominator | Local jail use |
| Texas rate | TCJS statewide reports | State context |
| National rate | BJS jail reports | National context |
The exact county, state, and national rate per 100,000 depends on the report year and method, so cite a date alongside any number.
Nueces County Jail Population Trends
Trends matter more than any single month. Counties watch admission rates, average length of stay, and the share of pretrial defendants over time to see whether the jail is filling because of more arrests, slower court dockets, or longer holds. The Sheriff's 2024-2025 annual report and the older 2022-2023 and 2021-2022 reports give a starting baseline for a Nueces County five-year view.
Read the TCJS monthly reports next to the sheriff annual report. When the two diverge, the difference often points to a counting question, such as whether contract holds are included.
Searching for Nueces County Inmate Records by Name
This page is population data, not an individual lookup. For a name search or a current custody check, the Nueces County inmate records page covers the Sheriff's Office contact path, the TDCJ search for state prisoners, and the BOP locator for federal inmates.
Where the Data Comes From
For Nueces County jail population data, the official sources are the Texas Commission on Jail Standards monthly and annual reports, the Sheriff's Office annual reports, and the U.S. Census Bureau QuickFacts page for county denominators. The Bureau of Justice Statistics and the Vera Institute of Justice add state and national context. Cite the source and the report year when you publish or share a number.
Avoid unofficial scrapers and outdated copies. The Sheriff's Office is the authoritative voice on the local jail, and TCJS is the authoritative voice on state oversight.